Dashboards
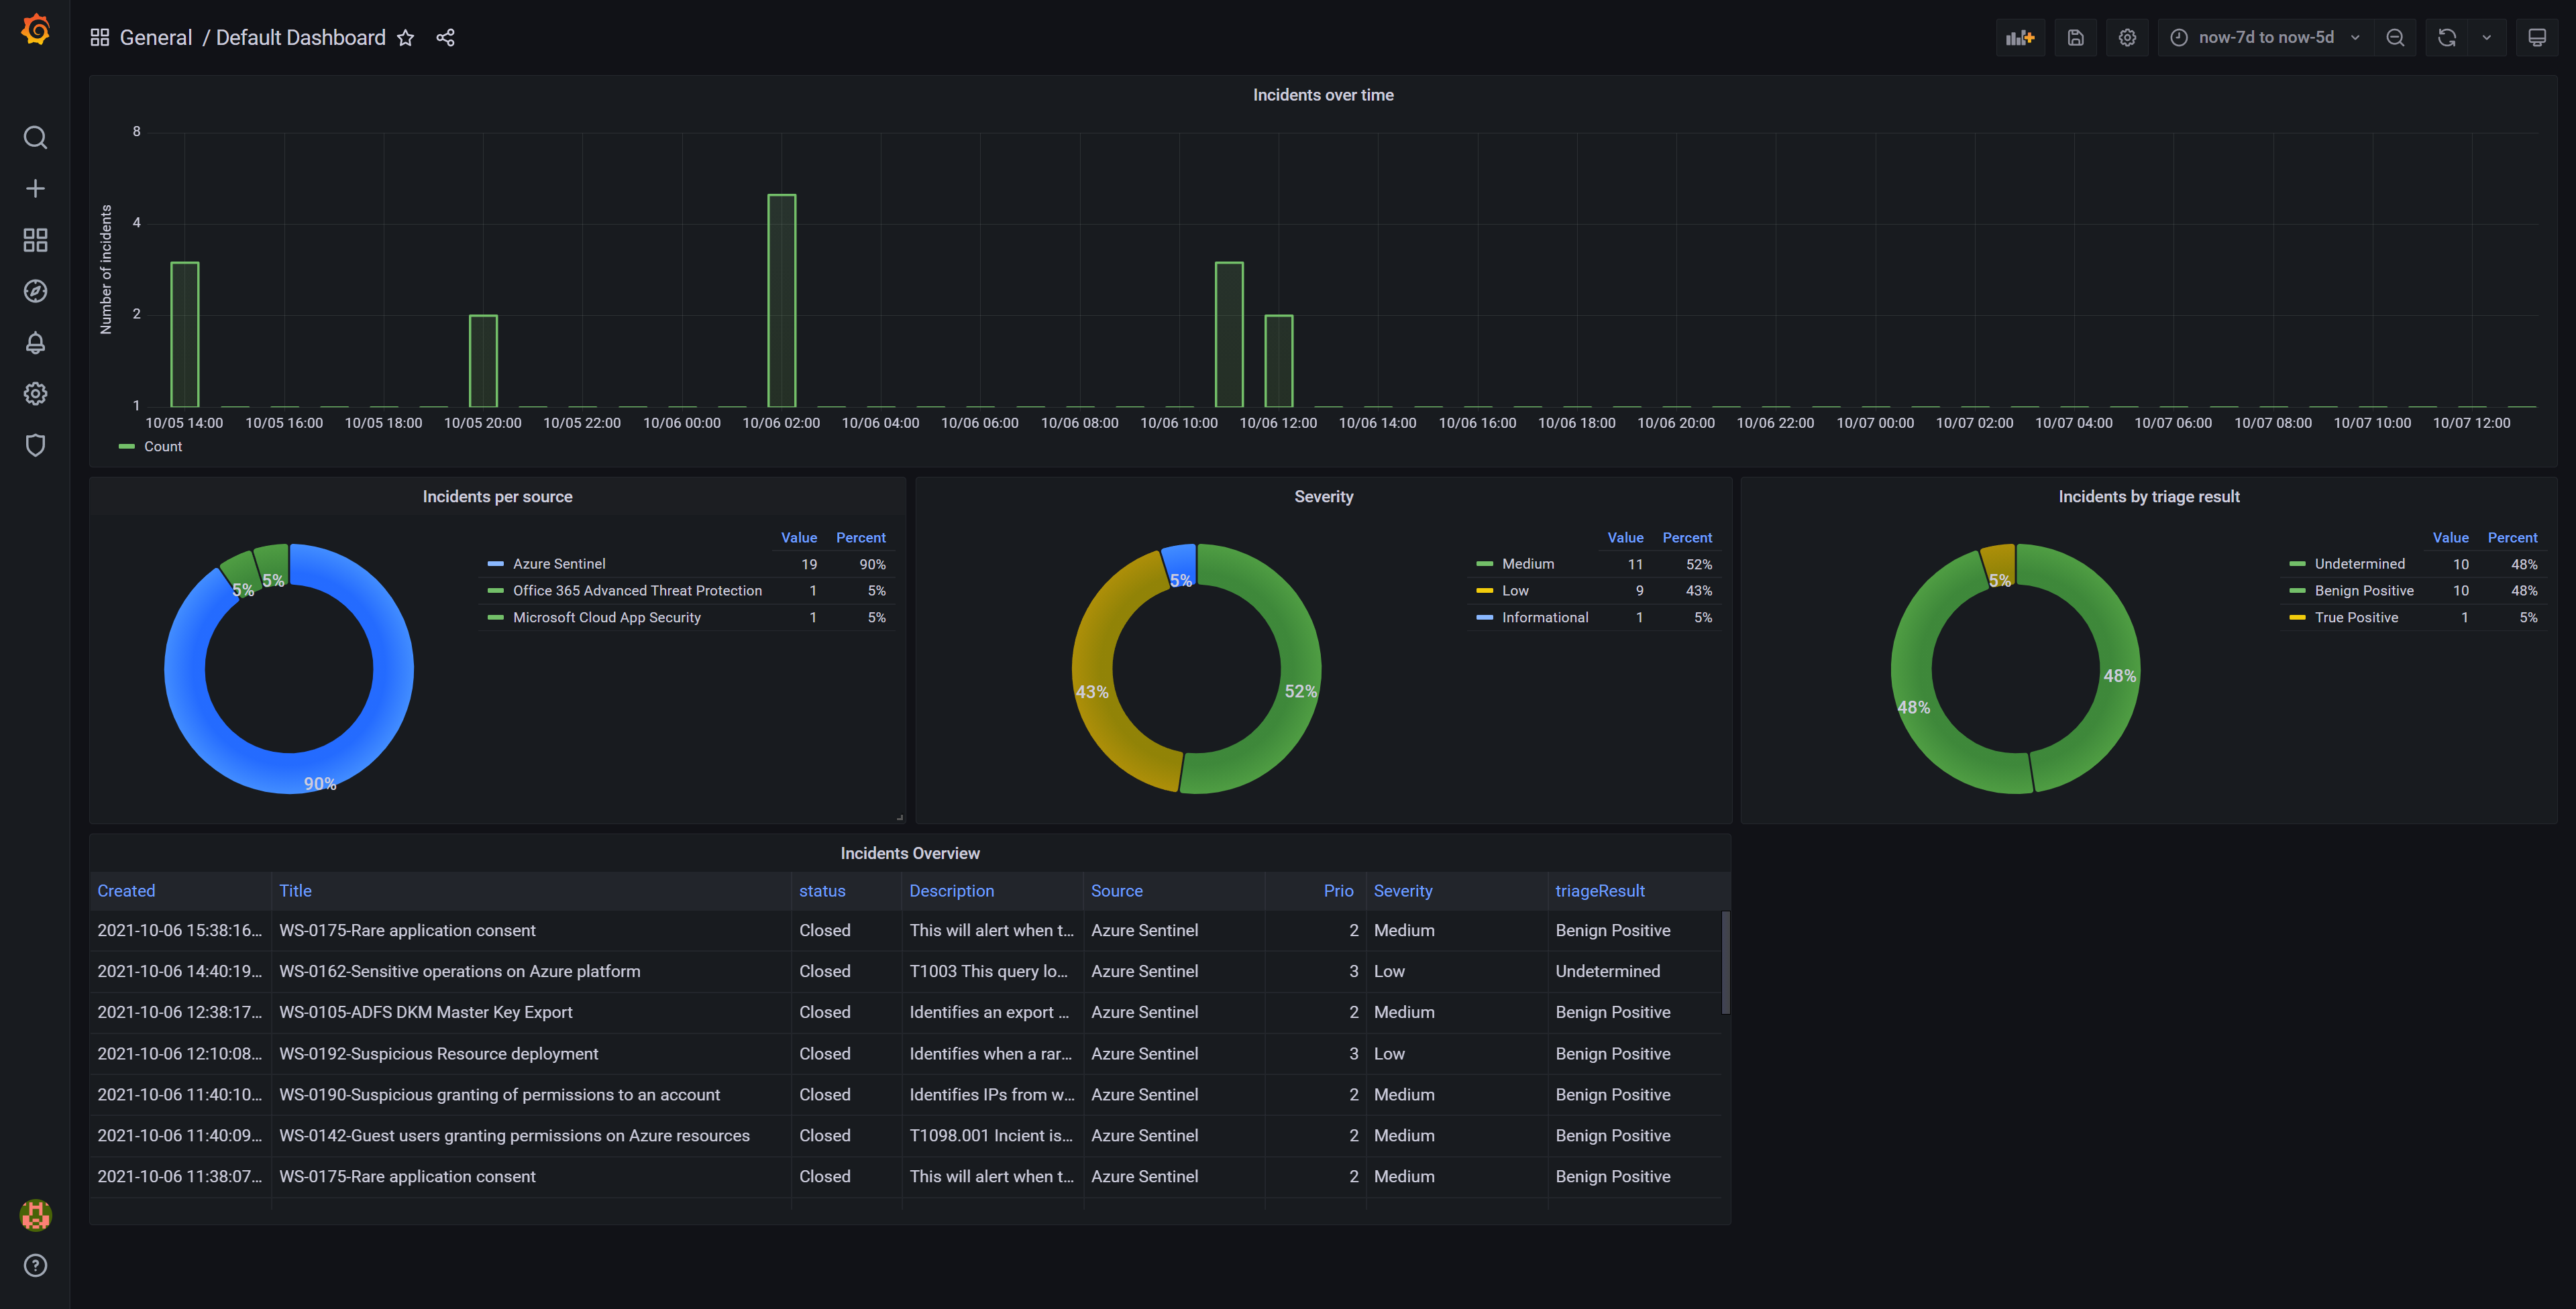
Wortell has a dashboard environment available that the customer can use to have realtime insights in their Wortell Managed Detection and Response offering.
Table of contents
Dashboard Portal
Wortell uses Grafana to provide dashboards. Grafana is a multi-platform open source analytics and interactive visualization web application. It provides charts, tables and graphs to give insights in the performance and security posture of an organisation.

Getting permissions
Only selected users have permissions to the Wortell Managed Detection and Response dashboars. As part of the MDR onboardings (after 01-20-2021), a list of users (and their corresponding UPNs) that need to have access to the dashboards is requested. These users have access to their organisations dashboard.
Login
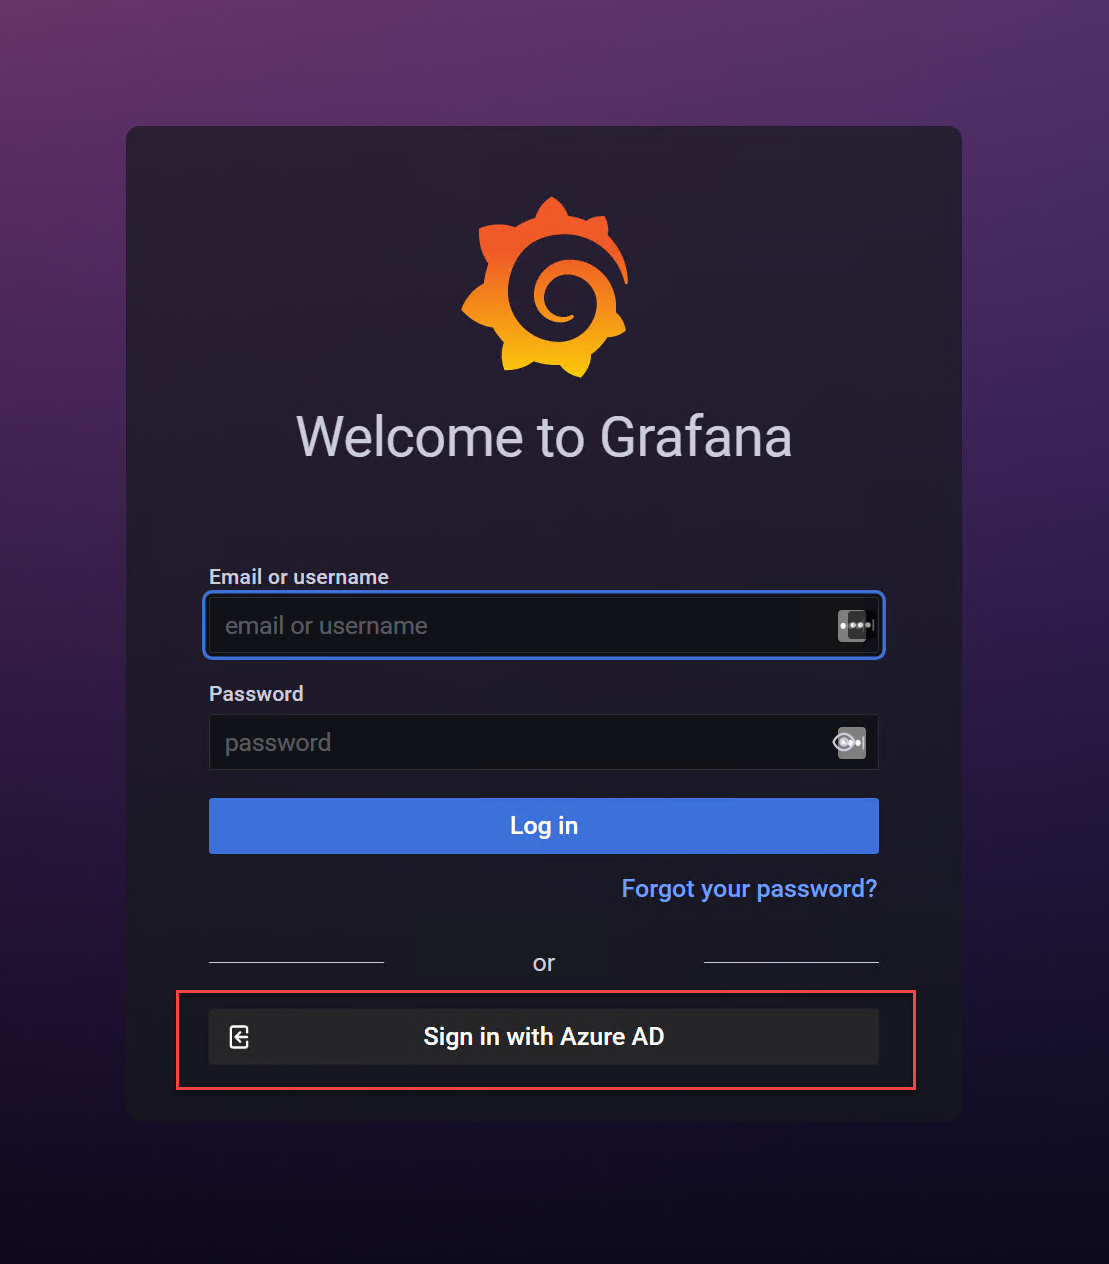
In order to display the Managed Detection and Response dashboards, go to https://dashboard.wortellenterprisesecurity.com. Here you can login by clicking on Sign in with Azure AD. The familliar login page for Azure Active Directory accounts will appear. You can login by using your work or school account.

Application approval
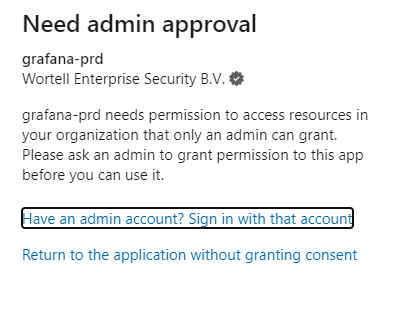
The Grafana instance of Wortell needs access to some user details like UPN and email address. This is needed to get access to Wortell’s Dashboard. This is only needed to logon and no access to the Azure AD Tenant or Azure subscriptions will be realized this way.
Please approve the admin approval company-wide with an admin account in the Azure AD environment. After this, the users can log on and access the dashboard.

Opening your dashboard
To display the dashboard, in the menu click on Dashboards ![]() , next click on Manage. A list of all available dashboards gets presented. Click on the dashboard that you would like to view (e.g. Default Dashboard)
, next click on Manage. A list of all available dashboards gets presented. Click on the dashboard that you would like to view (e.g. Default Dashboard)
